Modify the values and click the calculate button to use
BMI Calculator
Result
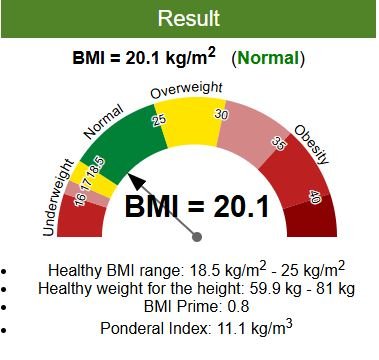
The Body Mass Index (BMI) Calculator can be used to calculate BMI value and corresponding weight status while taking age into consideration. Use the “Metric Units” tab for the International System of Units or the “Other Units” tab to convert units into either US or metric units. Note that the calculator also computes the Ponderal Index in addition to BMI, both of which are discussed below in detail.
Understanding BMI body fat calculator: What It Means for Your Health
If you’ve ever used a Body fat calculator, you’ve probably wondered what that single number really tells you. Body Mass Index isn’t a diagnosis or a perfect measure of your health — but it’s a quick, widely used way to get a general sense of whether your weight falls into a healthy range for your height. Here’s a breakdown of what BMI actually measures, why it matters, and where it falls short.
What Is BMI body fat calculator, Exactly?
BMI is essentially a ratio between your weight and the square of your height. It doesn’t measure body fat directly, but it’s used as a stand-in for estimating how much of your body mass might be fat versus lean tissue. Because it’s simple to calculate and doesn’t require any special equipment, it’s become one of the most common screening tools used by doctors, researchers, and public health organizations around the world.
The number you get from a BMI calculation is then compared against standard ranges to sort people into categories — underweight, normal weight, overweight, or obese. These cutoffs aren’t arbitrary; they’re based on population-level data showing where health risks tend to rise. That said, the exact boundaries can shift a bit depending on the organization, the region, or the age group being assessed.
BMI Categories for Adults
For adults aged 20 and older, the World Health Organization has set the following standard classifications, which apply the same way to both men and women:
| Classification | BMI Range (kg/m²) |
|---|---|
| Severe Thinness | Below 16 |
| Moderate Thinness | 16 to 17 |
| Mild Thinness | 17 to 18.5 |
| Normal | 18.5 to 25 |
| Overweight | 25 to 30 |
| Obese Class I | 30 to 35 |
| Obese Class II | 35 to 40 |
| Obese Class III | Above 40 |
Most adults aim to stay somewhere in that 18.5–25 “normal” window, since it’s associated with the lowest average health risk across large populations.
BMI in Children and Teens
BMI works a little differently for younger people. Because kids’ bodies change so much as they grow, the Centers for Disease Control and Prevention doesn’t use fixed number ranges for children between ages 2 and 20. Instead, a child’s BMI is plotted against a percentile chart that accounts for age and sex:
| Category | Percentile Range |
|---|---|
| Underweight | Below the 5th percentile |
| Healthy Weight | 5th to 85th percentile |
| At Risk of Overweight | 85th to 95th percentile |
| Overweight | Above the 95th percentile |
This percentile-based approach gives a more accurate picture for growing bodies than a flat numeric cutoff would.
Why a High BMI Matters
Carrying excess weight is linked to a long list of health complications. According to the CDC, people with a higher BMI face an increased likelihood of:
- High blood pressure
- Unfavorable cholesterol levels — more “bad” LDL, less “good” HDL, and elevated triglycerides
- Type 2 diabetes
- Heart disease and stroke
- Gallbladder problems
- Osteoarthritis from added strain on the joints
- Sleep apnea and other breathing difficulties
- Several types of cancer, including those affecting the breast, colon, kidney, liver, and reproductive organs
- Mental health challenges such as depression and anxiety
- A generally higher risk of early death compared to people in the normal BMI range
None of this means a higher number automatically equals poor health — but it’s a signal worth paying attention to, and one worth discussing with a doctor if it applies to you.
Why Being Underweight Carries Risks Too
It’s easy to focus only on the dangers of excess weight, but falling below a healthy BMI comes with its own set of concerns:
- Nutrient deficiencies and anemia
- Weaker bones and a higher risk of fractures
- A compromised immune system
- Delayed growth and development, especially in kids and teens
- Hormonal disruptions in women that can affect fertility and increase miscarriage risk
- Greater risk of complications from surgery
- An elevated overall mortality risk, similar to what’s seen at the high end of the BMI scale
Being underweight can sometimes point to an underlying issue — anything from a medical condition to disordered eating — so it’s worth investigating rather than ignoring, especially if there’s no obvious explanation.
Where BMI Falls Short
BMI is useful, but it’s far from perfect. The core issue is that it measures total weight relative to height — not fat specifically. Two people can have the same BMI and very different body compositions.
For adults, factors like age, sex, ethnicity, and muscle mass all affect how meaningful a given BMI number really is. A sedentary older adult might carry more fat than their BMI suggests, while a heavily muscled athlete might land in the “overweight” range despite being lean and fit. In general:
- Older adults tend to carry more fat than younger adults at the same BMI.
- Women typically have more body fat than men, even at an identical BMI.
- Athletes and heavily muscled individuals often post higher BMIs simply due to muscle mass, not excess fat.
For children and teens, the picture is even more nuanced. Growth stage and puberty timing can shift how BMI relates to actual body fat. It tends to be a fairly reliable indicator for kids who are clearly obese, but less precise for those in the “overweight” range, where the extra weight could come from muscle or other lean tissue rather than fat.
Despite these limitations, research suggests BMI does a reasonably good job of reflecting body fat for the large majority of people — somewhere in the range of 90–95% of the population — which is why it remains a go-to first screening tool.
The Math Behind BMI
For anyone curious about the formula itself, here’s how it works using a person who is 5’10” and weighs 160 pounds as an example:
US (Imperial) units: BMI = 703 × weight (lbs) ÷ height² (inches) BMI = 703 × 160 ÷ 70² ≈ 23.0
Metric units: BMI = weight (kg) ÷ height² (meters) BMI = 72.57 ÷ 1.78² ≈ 23.0
Both formulas land on the same result — they’re just adjusted for different unit systems.
Two Related Numbers: BMI Prime and Ponderal Index
Beyond the standard BMI score, two lesser-known figures can add extra context.
BMI Prime compares your actual BMI to the upper edge of the “normal” range (25 kg/m²). It’s calculated simply as:
BMI Prime = Your BMI ÷ 25
Since it’s a ratio, BMI Prime has no units — it’s just a number that shows how close you are to that upper threshold. A value under 0.74 suggests underweight, 0.74–1.0 is normal, above 1.0 signals overweight, and above 1.2 points to obesity. This scale is handy for comparing people across regions where the “normal” BMI ceiling might differ slightly.
| Classification | BMI | BMI Prime |
|---|---|---|
| Severe Thinness | Below 16 | Below 0.64 |
| Moderate Thinness | 16–17 | 0.64–0.68 |
| Mild Thinness | 17–18.5 | 0.68–0.74 |
| Normal | 18.5–25 | 0.74–1.0 |
| Overweight | 25–30 | 1.0–1.2 |
| Obese Class I | 30–35 | 1.2–1.4 |
| Obese Class II | 35–40 | 1.4–1.6 |
| Obese Class III | Above 40 | Above 1.6 |
Ponderal Index is a close cousin of BMI, but instead of squaring height, it cubes it. This small change makes it more reliable for people at the extreme ends of the height spectrum — very tall or very short — where standard BMI can produce skewed results.
Using the same 5’10”, 160-lb example:
US units: PI = height (in) ÷ ∛weight (lbs) = 70 ÷ ∛160 ≈ 12.9
Metric units: PI = weight (kg) ÷ height³ (m) = 72.57 ÷ 1.78³ ≈ 12.9
The Bottom Line
BMI is a convenient starting point for thinking about weight and health, not a final verdict. It can’t tell the difference between muscle and fat, and it doesn’t account for individual factors like bone structure, activity level, or where fat is distributed on the body. Still, for most people, it’s a reasonably solid indicator of whether it’s worth digging deeper — through a conversation with a doctor, additional testing, or simply a closer look at diet and exercise habits.
If your BMI falls outside the “normal” range, it doesn’t mean something is automatically wrong. It just means it might be worth having a conversation with a healthcare provider who can look at the full picture — not just one number.